...
Usage
# S4 method for class 'SpatialData'
plotImage(
  x,
  i = 1,
  j = 1,
  k = NULL,
  ch = NULL,
  c = NULL,
  cl = NULL,
  t = NULL,
  z = NULL
)

plotSpatialData()
Arguments
- x
SpatialDataobject.- i
element to use from a given layer.
- j
index or name of target coordinate system.
- k
index of the scale to render; by default (NULL), will auto-select scale in order to minimize memory-usage and blurring for a target size of 800 x 800px; use Inf to plot the lowest resolution available.
- ch
image channel(s) to be used for plotting (defaults to the first channel(s) available); use
channels()to see which channels are available for a givenSpatialDataImage- c
character vector; colors to use for each channel.
- cl
list of length-2 numeric vectors (non-negative, increasing); specifies channel-wise contrast limits - defaults to [0, 1] for all (ignored when
image(x, i)is an RGB image; for convenience, any NULL = [0, 1], and n = [0, n]).- t, z
integer scalar to indicate a specific time- or z-slice; if left unspecified (default NULL), will perform a max-projection.
Examples
x <- file.path("extdata", "blobs.zarr")
x <- system.file(x, package="spatialdataR")
x <- readSpatialData(x, tables=FALSE)
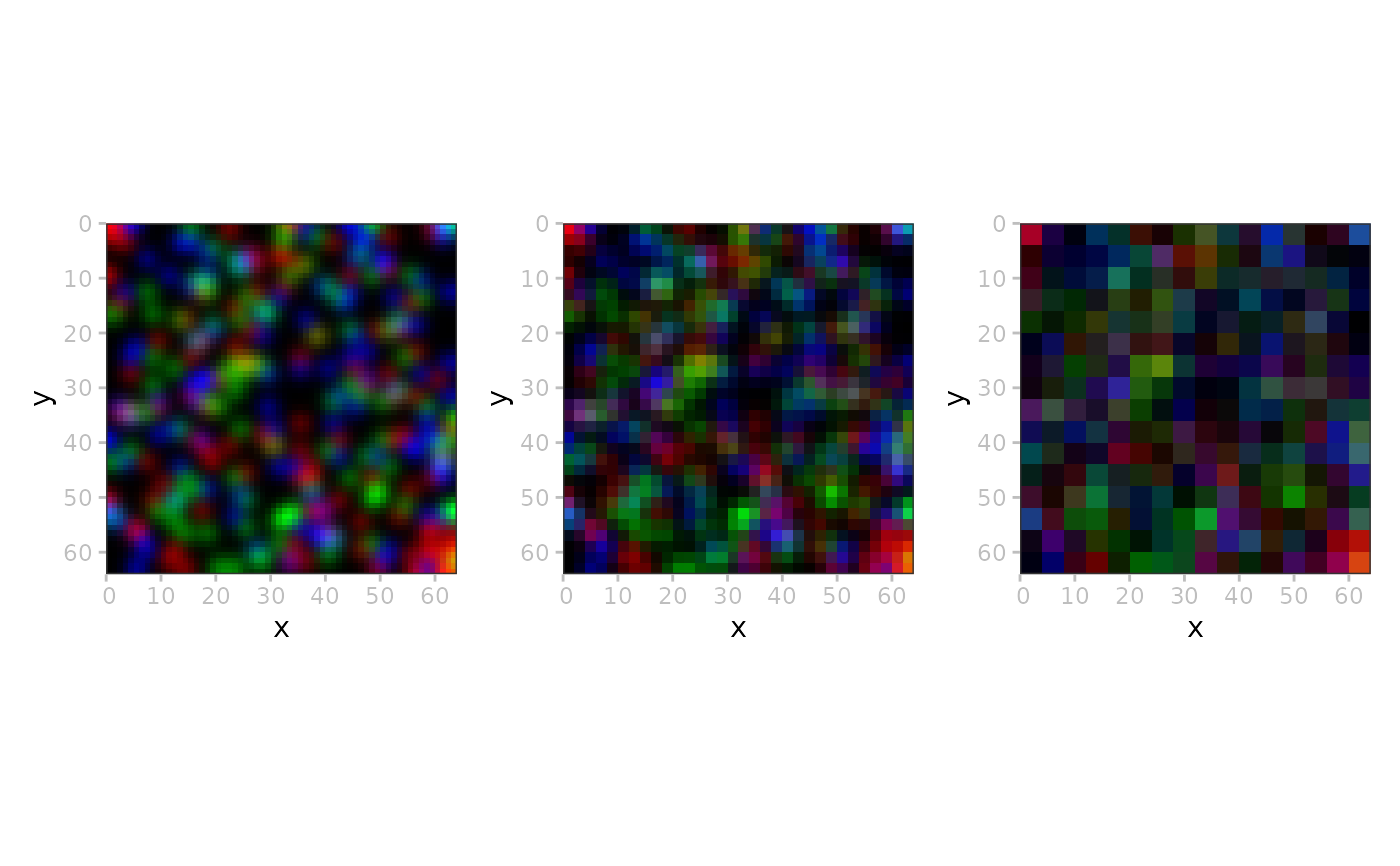
ms <- lapply(seq(3), \(.)
plotSpatialData() +
plotImage(x, i=2, k=.))
patchwork::wrap_plots(ms)
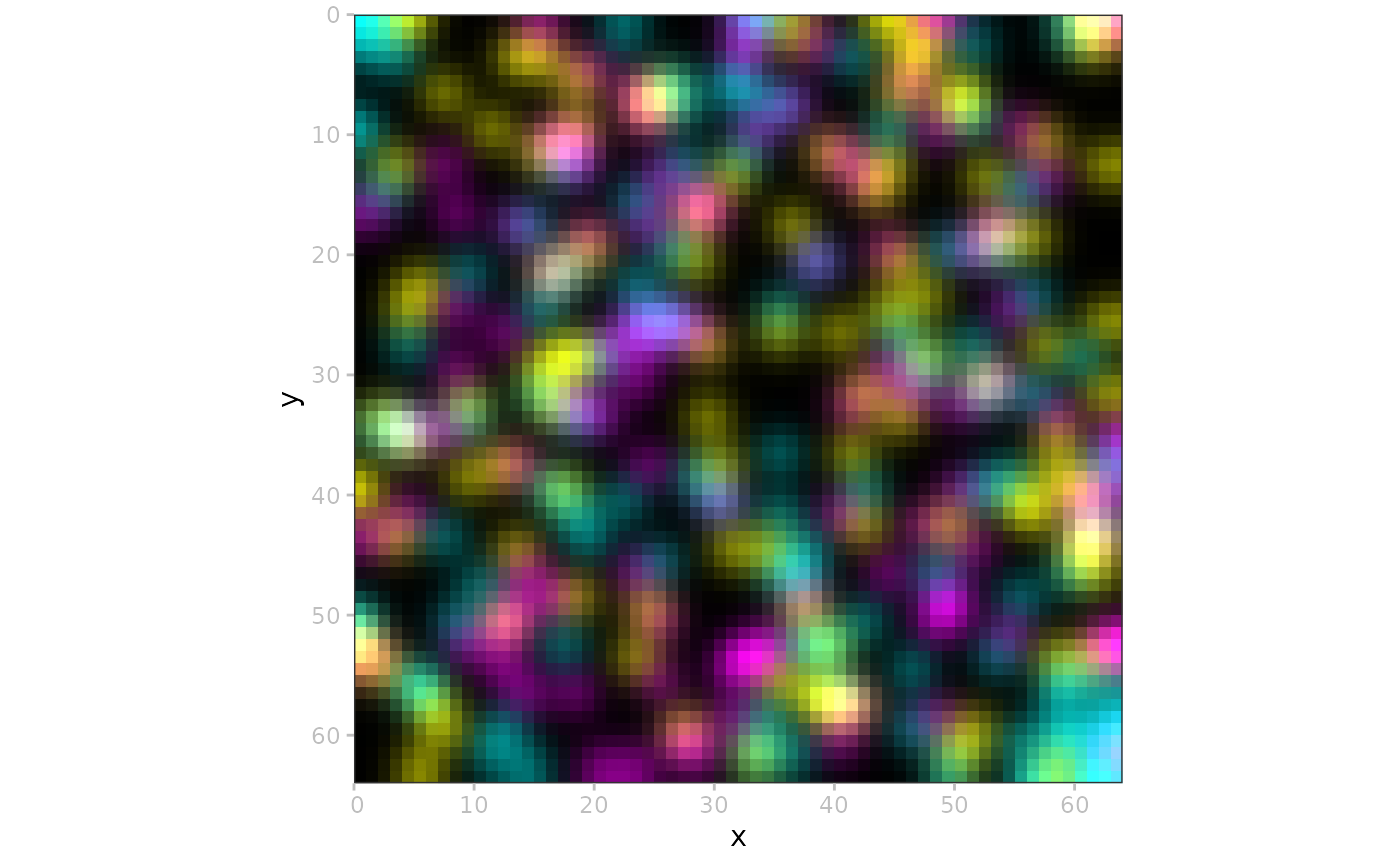
 # custom colors
cmy <- c("cyan", "magenta", "yellow")
plotSpatialData() + plotImage(x, c=cmy)
# custom colors
cmy <- c("cyan", "magenta", "yellow")
plotSpatialData() + plotImage(x, c=cmy)
 # contrast limits
cl <- rep(list(c(0, 1/3)), 3)
plotSpatialData() + plotImage(x, k=1, c=cmy, cl=cl)
# contrast limits
cl <- rep(list(c(0, 1/3)), 3)
plotSpatialData() + plotImage(x, k=1, c=cmy, cl=cl)
