Coord. trans. graph
Usage
# S4 method for class 'SpatialData'
CTgraph(x)

# S4 method for class 'SpatialDataElement'
CTgraph(x)

# S4 method for class 'ANY'
CTgraph(x)

# S4 method for class 'SpatialData'
CTpath(x, i, j)

# S4 method for class 'SpatialDataElement'
CTpath(x, j)

# S4 method for class 'ANY'
CTpath(x)

CTplot(g, cex = 0.5, fac = 2, max = 10)
Arguments
- x
SpatialData, an element, orSpatialDataAttrs.- i
character string; name of source node.
- j
character string; name of target coordinate space.
- g
base R graph; extracted with
CTgraph.- cex
scalar numeric; controls fontsize of node labels.
- fac, max
scalar numeric; node labels with
nchar>maxare split and hyphenated at positionfloor(nchar/fac)
Value
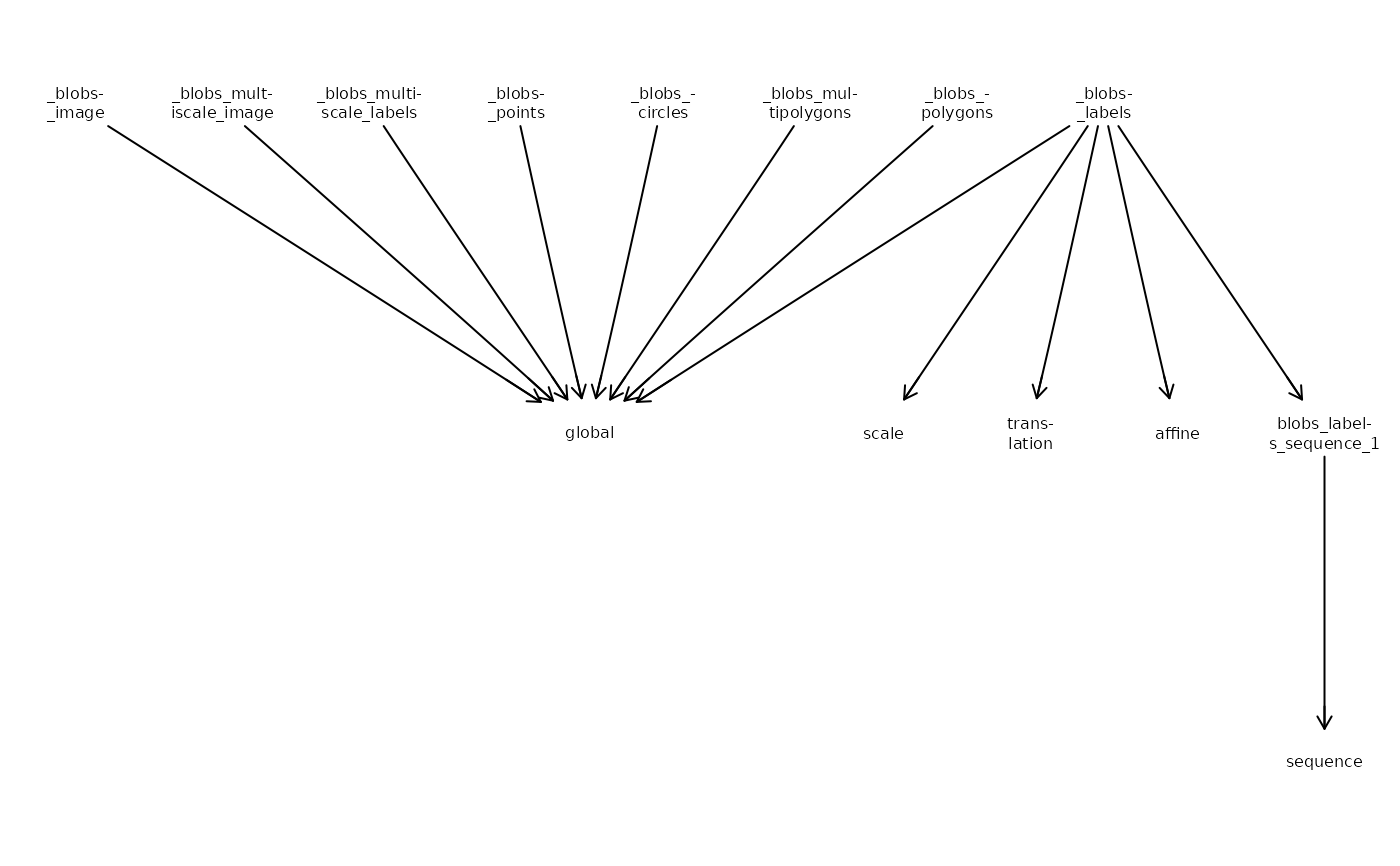
CTgraph:graph::graphAMobject with nodes for each element and coordinate space, and edges for each transformation (if specified)CTpath: list of transformations fromitoj; length > 1 iftypeis"sequential", length-1 otherwise; each element specifiestypeanddataof the transformationCTplot: visualizes the element-coordinate space graph withRgraphviz
Examples
x <- file.path("extdata", "blobs.zarr")
x <- system.file(x, package="SpatialData")
x <- readSpatialData(x, tables=FALSE)
# object-wide
g <- CTgraph(x)
CTplot(g)
 # one element
y <- label(x)
g <- CTgraph(y)
CTplot(g)
# one element
y <- label(x)
g <- CTgraph(y)
CTplot(g)
 # retrieve transformation(s)
# from element to target space
CTpath(x, "blobs_labels", "sequence")
#> [[1]]
#> [[1]]$data
#> [[1]]$data[[1]]
#> [1] 3
#>
#> [[1]]$data[[2]]
#> [1] 2
#>
#>
#> [[1]]$type
#> [1] "scale"
#>
#>
#> [[2]]
#> [[2]]$data
#> [[2]]$data[[1]]
#> [1] -50
#>
#> [[2]]$data[[2]]
#> [1] 10
#>
#>
#> [[2]]$type
#> [1] "translation"
#>
#>
# retrieve transformation(s)
# from element to target space
CTpath(x, "blobs_labels", "sequence")
#> [[1]]
#> [[1]]$data
#> [[1]]$data[[1]]
#> [1] 3
#>
#> [[1]]$data[[2]]
#> [1] 2
#>
#>
#> [[1]]$type
#> [1] "scale"
#>
#>
#> [[2]]
#> [[2]]$data
#> [[2]]$data[[1]]
#> [1] -50
#>
#> [[2]]$data[[2]]
#> [1] 10
#>
#>
#> [[2]]$type
#> [1] "translation"
#>
#>