library(sf)
library(dplyr)
library(ggplot2)
library(patchwork)
library(spatialdataR)
library(SpatialData.data)
library(SpatialData.plot)MERFISH
spatial transcriptomics
imaging-based
preamble
(sd <- SD.data_load("MouseBrainMERFISH"))class: SpatialData
- images(1): rasterized
- points(1):
- single_molecule (3714642)
- shapes(2):
- anatomical (6,polygon)
- cells (2389,circle)
- tables(1):
- table (268,2389) [cells]
coordinate systems(1):
- global(4): rasterized anatomical cells single_moleculeanalysis
feature_key(p <- point(sd))[1] "cell_type"data(p) |>
distinct(cell_type) |>
pull(cell_type)[1] "VISp_II/III" "VISp_V" "outside_VISp" "VISp_IV" "VISp"
[6] "VISp_VI" "VISp_wm" "VISp_I" filter(p, cell_type == "VISp_V")class: SpatialDataPoint
count: 589648
data(3): cell_type __null_dask_index__ geometryplotSpatialData(sd) +
plotImage() +
plotPoint(n=222, key="VISp_V", col="cyan")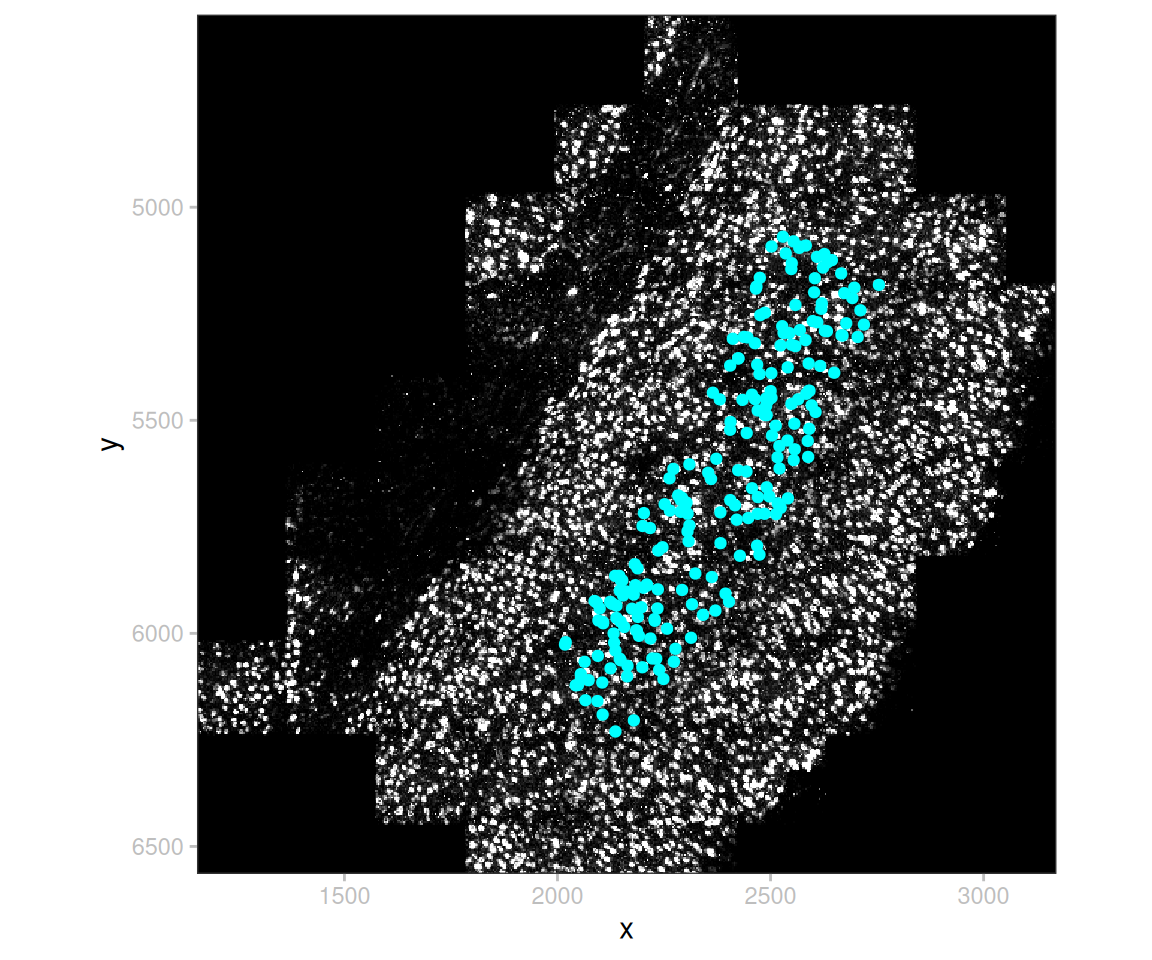
plotSpatialData(sd) +
    plotImage() +
    plotShape(linewidth=1, fill=NA, col="white") +   # regions
    plotPoint(size=0.2, n=4e3, colour="cell_type") + # transcripts
    guides(col=guide_legend(override.aes=list(size=2))) +
    scale_color_manual(values=rainbow(8))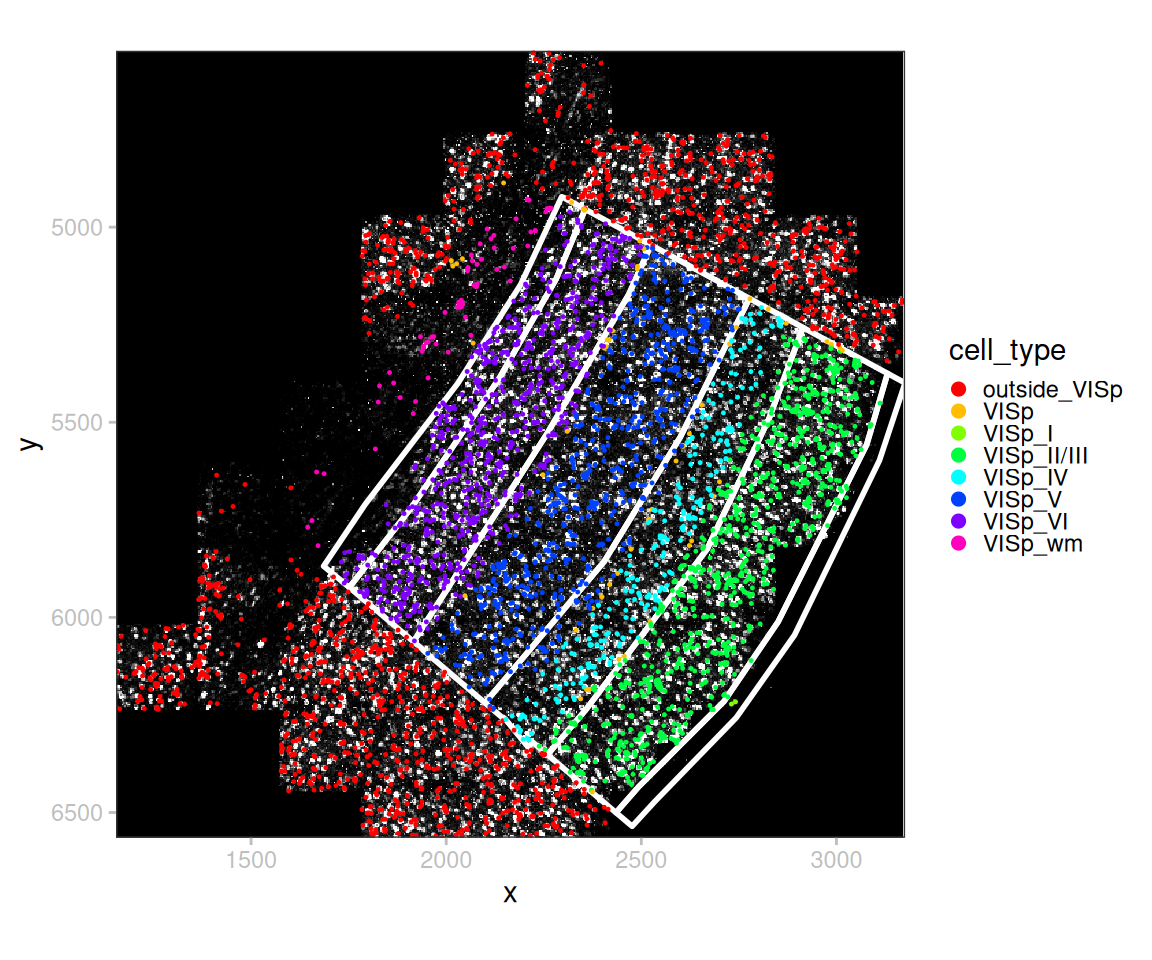
# downsample transcripts for speed
sp <- sd
p <- point(sp)
p <- p[sample(length(p), 2e4)]
point(sp) <- p
# query polygonal region + 10% expansion
s <- shape(sd, "anatomical")
ps <- lapply(seq_along(s), \(.) {
    roi <- st_buffer(st_as_sf(data(s[., ])), 0.1)
    sp <- crop(sp, roi)
    plotSpatialData(sp) +
        plotImage() + ggtitle(paste0("ROI", .)) +
        plotShape(fill=NA, col="gold", size=0.8) +
        plotPoint(n=2e3, col="turquoise", size=0.2)
})
wrap_plots(ps, nrow=2) & theme_void() & theme(plot.title=element_text(hjust=0.5))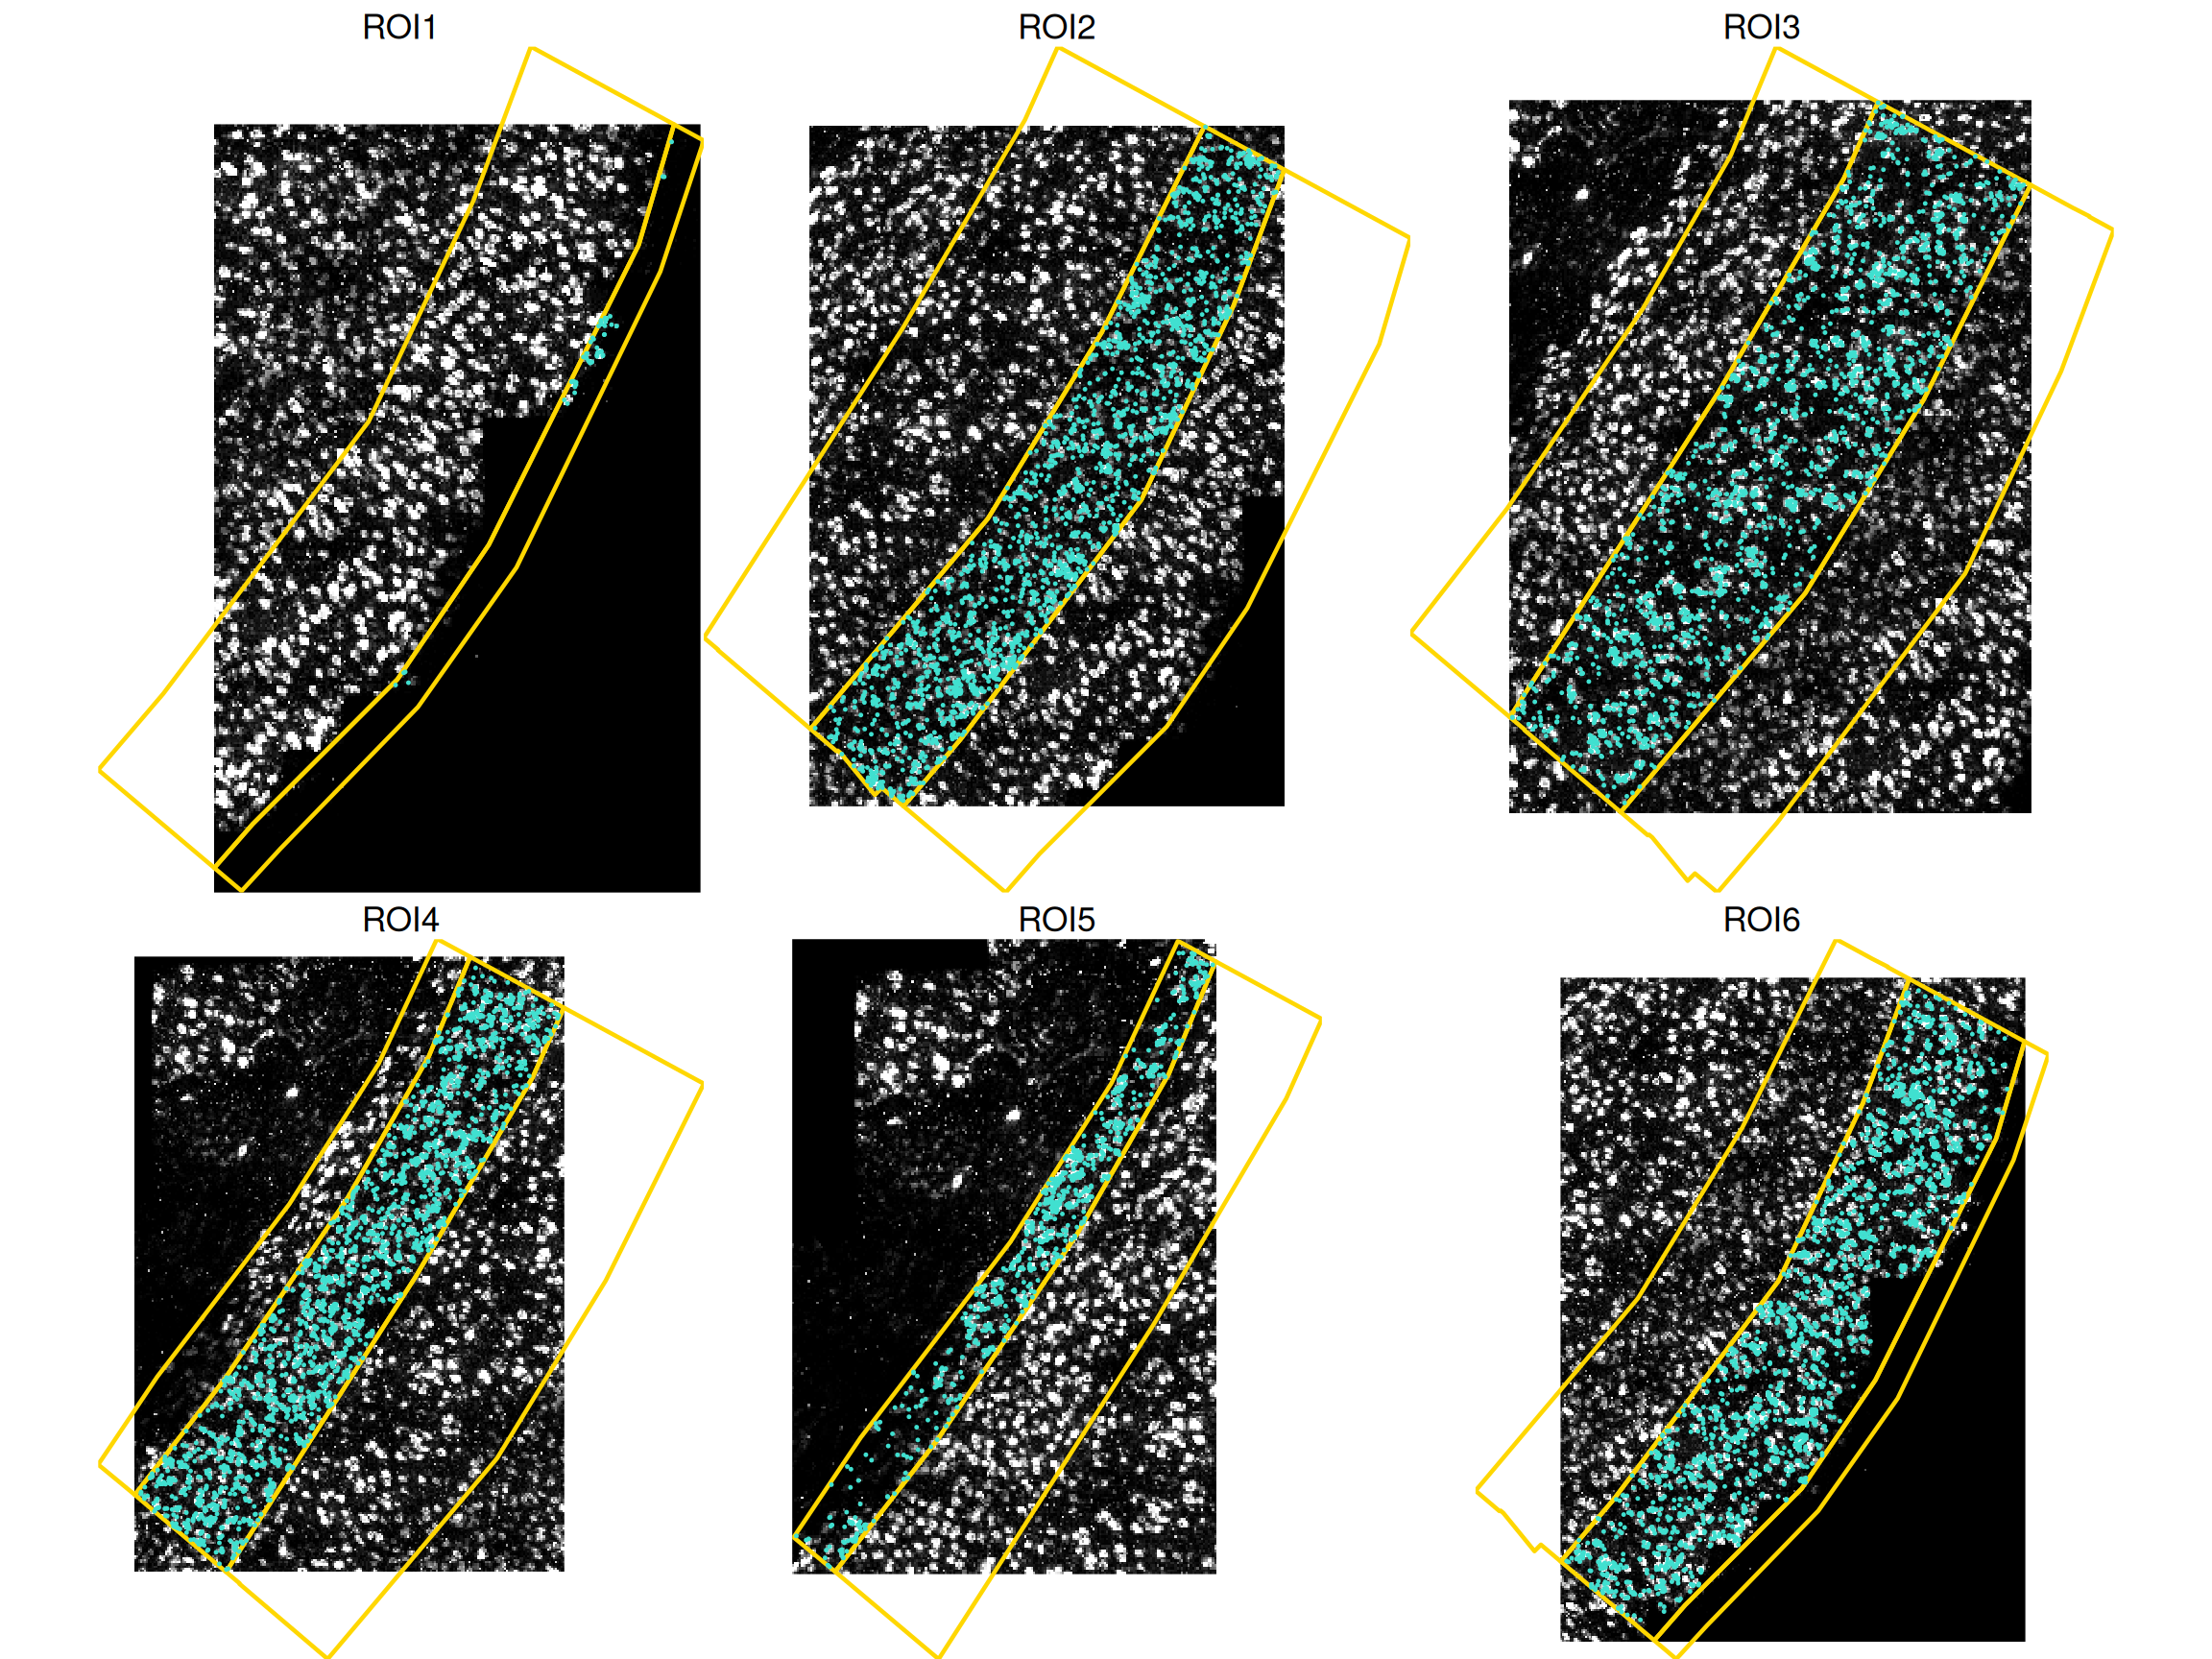
appendix
Notesession
sessionInfo()R version 4.6.2 (2026-10-29)
Platform: x86_64-pc-linux-gnu
Running under: Ubuntu 26.04.1 LTS
Matrix products: default
BLAS: /usr/lib/x86_64-linux-gnu/openblas-pthread/libblas.so.3
LAPACK: /usr/lib/x86_64-linux-gnu/openblas-pthread/libopenblasp-r0.3.32.so; LAPACK version 3.12.0
locale:
[1] LC_CTYPE=C.UTF-8 LC_NUMERIC=C LC_TIME=C.UTF-8
[4] LC_COLLATE=C.UTF-8 LC_MONETARY=C.UTF-8 LC_MESSAGES=C.UTF-8
[7] LC_PAPER=C.UTF-8 LC_NAME=C LC_ADDRESS=C
[10] LC_TELEPHONE=C LC_MEASUREMENT=C.UTF-8 LC_IDENTIFICATION=C
time zone: UTC
tzcode source: system (glibc)
attached base packages:
[1] stats graphics grDevices datasets utils methods base
other attached packages:
[1] SpatialData.plot_0.99.12 SpatialData.data_0.99.10 spatialdataR_0.99.47
[4] patchwork_1.3.2 ggplot2_4.0.4 dplyr_1.2.1
[7] sf_1.1-3
loaded via a namespace (and not attached):
[1] tidyselect_1.2.1 grumpy_0.2.0
[3] blob_1.3.0 farver_2.1.2
[5] filelock_1.0.3 R.utils_2.13.0
[7] S7_0.2.2 fastmap_1.2.0
[9] SingleCellExperiment_1.35.2 BiocFileCache_3.3.0
[11] duckdb_2.0.0 digest_0.6.39
[13] lifecycle_1.0.5 paws.storage_0.11.0
[15] RSQLite_3.53.3 magrittr_2.0.5
[17] compiler_4.6.2 rlang_1.3.0
[19] tools_4.6.2 yaml_2.3.12
[21] knitr_1.52 S4Arrays_1.13.2
[23] htmlwidgets_1.6.4 bit_4.6.0
[25] classInt_0.4-11 curl_8.1.0
[27] reticulate_1.47.0 DelayedArray_0.39.8
[29] xml2_1.6.0 RColorBrewer_1.1-3
[31] abind_1.4-8 KernSmooth_2.23-27
[33] withr_3.0.3 purrr_1.2.2
[35] BiocGenerics_0.59.12 R.oo_1.27.1
[37] grid_4.6.2 stats4_4.6.2
[39] e1071_1.7-17 scales_1.4.0
[41] SummarizedExperiment_1.43.0 cli_3.6.6
[43] rmarkdown_2.32 generics_0.1.4
[45] cachem_1.1.0 DBI_1.3.0
[47] proxy_0.4-29 BiocManager_1.30.27
[49] XVector_0.53.0 matrixStats_1.5.0
[51] vctrs_0.7.3 Matrix_1.7-6
[53] jsonlite_2.0.0 IRanges_2.47.5
[55] S4Vectors_0.51.10 bit64_4.8.6
[57] RBGL_1.89.0 ggnewscale_0.5.2
[59] units_1.0-1 glue_1.8.1
[61] ZarrArray_1.1.7 gtable_0.3.6
[63] Rarr_2.1.69 GenomicRanges_1.65.4
[65] tibble_3.3.1 pillar_1.11.1
[67] htmltools_0.5.9 Seqinfo_1.3.2
[69] graph_1.91.0 dbplyr_2.6.0
[71] R6_2.6.1 httr2_1.3.0
[73] wk_0.9.5 evaluate_1.0.5
[75] lattice_0.23-1 Biobase_2.73.2
[77] R.methodsS3_1.8.2 png_0.1-9
[79] duckspatial_1.4.0 memoise_2.0.1
[81] renv_1.3.1 paws.common_0.9.0
[83] class_7.3-24 uuid_1.2-2
[85] Rcpp_1.1.2 SparseArray_1.13.4
[87] anndataR_1.3.5 xfun_0.62
[89] MatrixGenerics_1.25.0 pkgconfig_2.0.3