SpatialData point/shape viz.
Usage
# S4 method for class 'SpatialData'
plotShape(x, i = 1, j = 1, assay = 1, ...)

# S4 method for class 'SpatialData'
plotPoint(x, i = 1, j = 1, ...)
Arguments
- x
SpatialDataobject.- i
character string or index; the label element to plot.
- j
index or name of target coordinate system.
- assay
character string; in case of
cdenoting a row name, specifies whichassaydata to use (seegetTable). (ignored whenxis aSpatialDataPoint).- ...
option aesthetic arguments passed
geom_sf.
Examples
x <- file.path("extdata", "blobs.zarr")
x <- system.file(x, package="spatialdataR")
x <- readSpatialData(x)
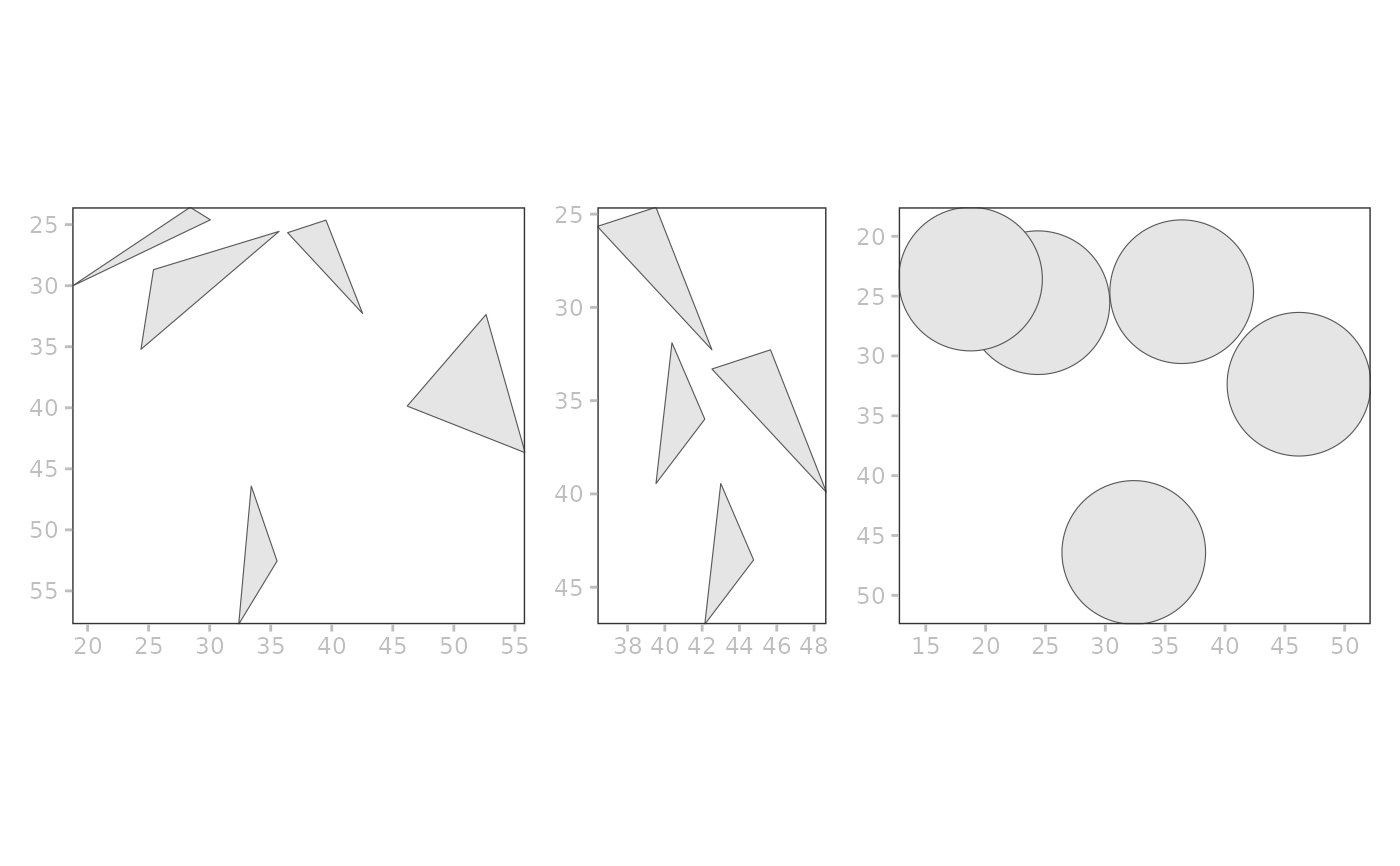
# shapes
p <- plotSpatialData()
a <- p + plotShape(x, "blobs_polygons")
#> Coordinate system already present.
#> ℹ Adding new coordinate system, which will replace the existing one.
b <- p + plotShape(x, "blobs_multipolygons")
#> Coordinate system already present.
#> ℹ Adding new coordinate system, which will replace the existing one.
c <- p + plotShape(x, "blobs_circles")
#> Coordinate system already present.
#> ℹ Adding new coordinate system, which will replace the existing one.
patchwork::wrap_plots(a, b, c)
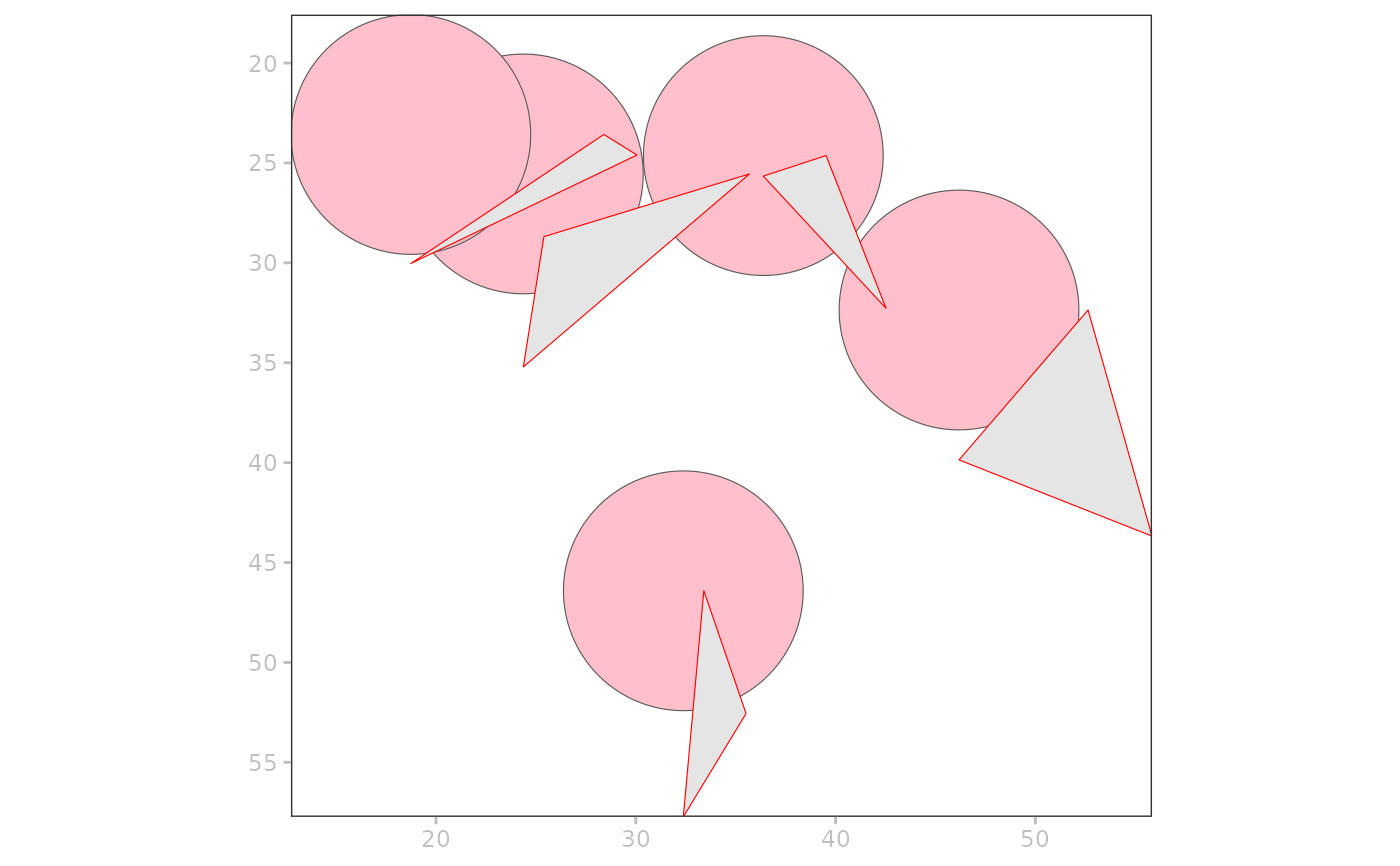
 # layered
p +
plotShape(x, "blobs_circles", fill="pink") +
plotShape(x, "blobs_polygons", colour="red")
#> Coordinate system already present.
#> ℹ Adding new coordinate system, which will replace the existing one.
#> Coordinate system already present.
#> ℹ Adding new coordinate system, which will replace the existing one.
# layered
p +
plotShape(x, "blobs_circles", fill="pink") +
plotShape(x, "blobs_polygons", colour="red")
#> Coordinate system already present.
#> ℹ Adding new coordinate system, which will replace the existing one.
#> Coordinate system already present.
#> ℹ Adding new coordinate system, which will replace the existing one.
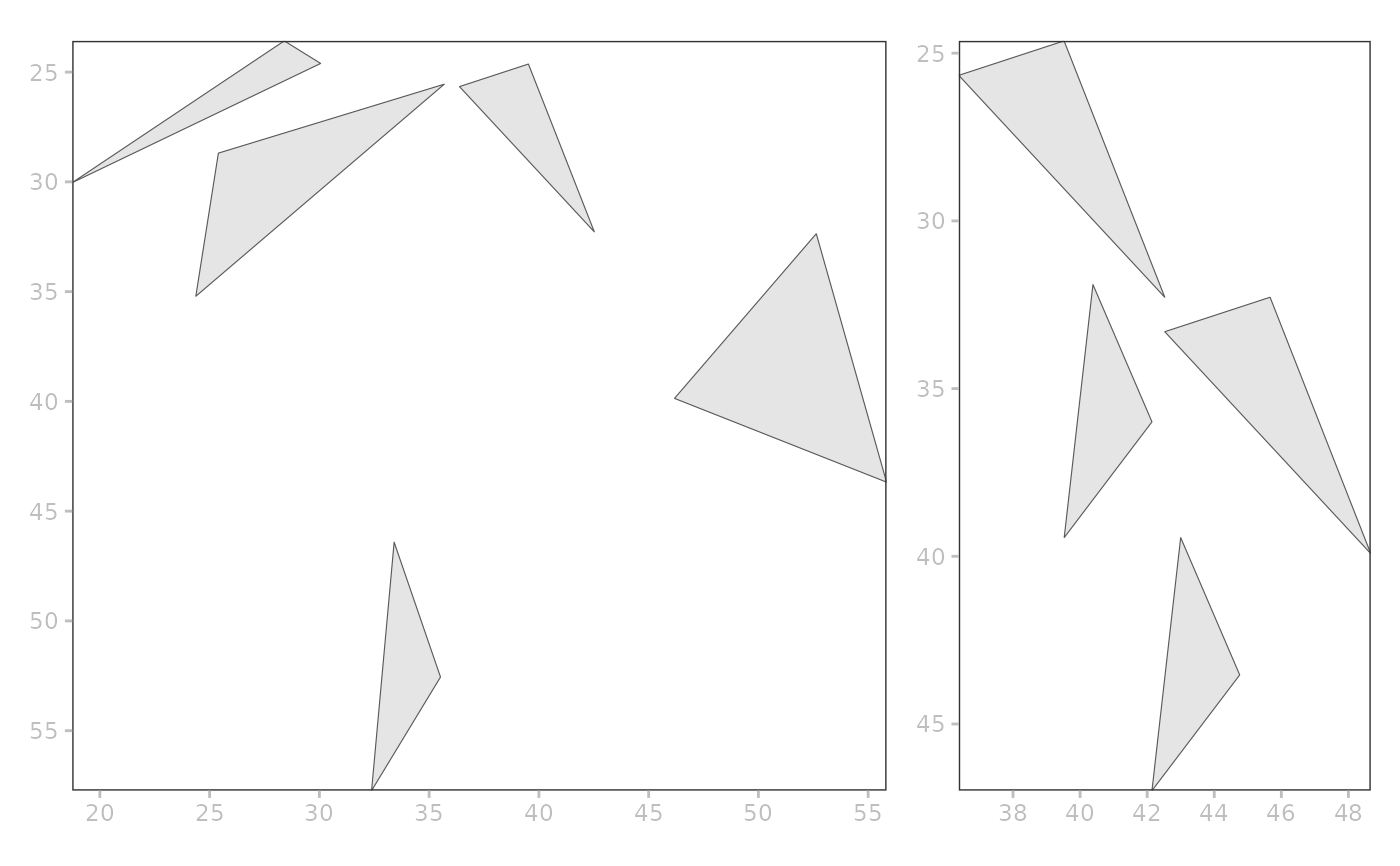
 patchwork::wrap_plots(a, b)
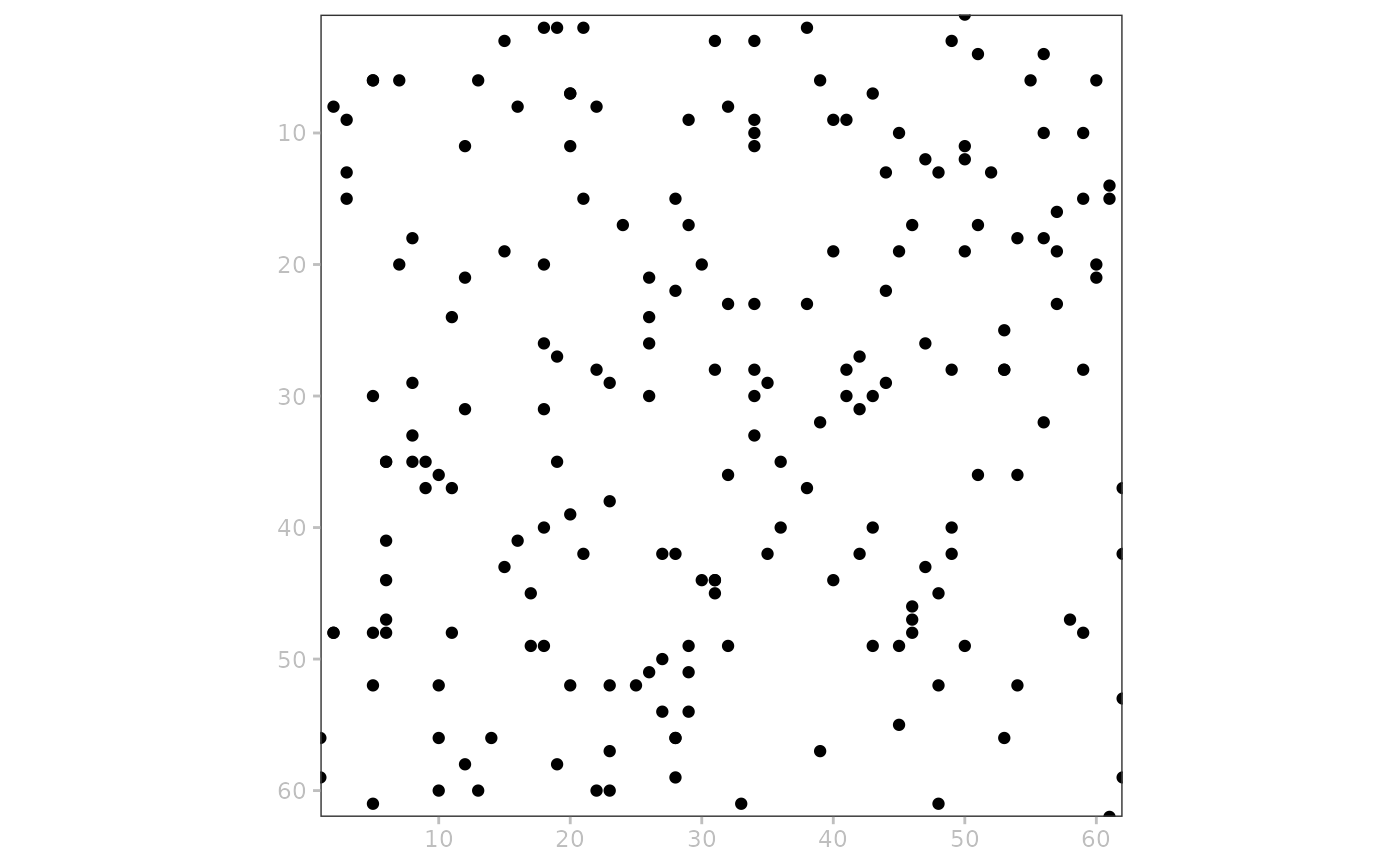
 # points
i <- "blobs_points"
p <- plotSpatialData()
p + plotPoint(x, i) # simple
#> Coordinate system already present.
#> ℹ Adding new coordinate system, which will replace the existing one.
# points
i <- "blobs_points"
p <- plotSpatialData()
p + plotPoint(x, i) # simple
#> Coordinate system already present.
#> ℹ Adding new coordinate system, which will replace the existing one.
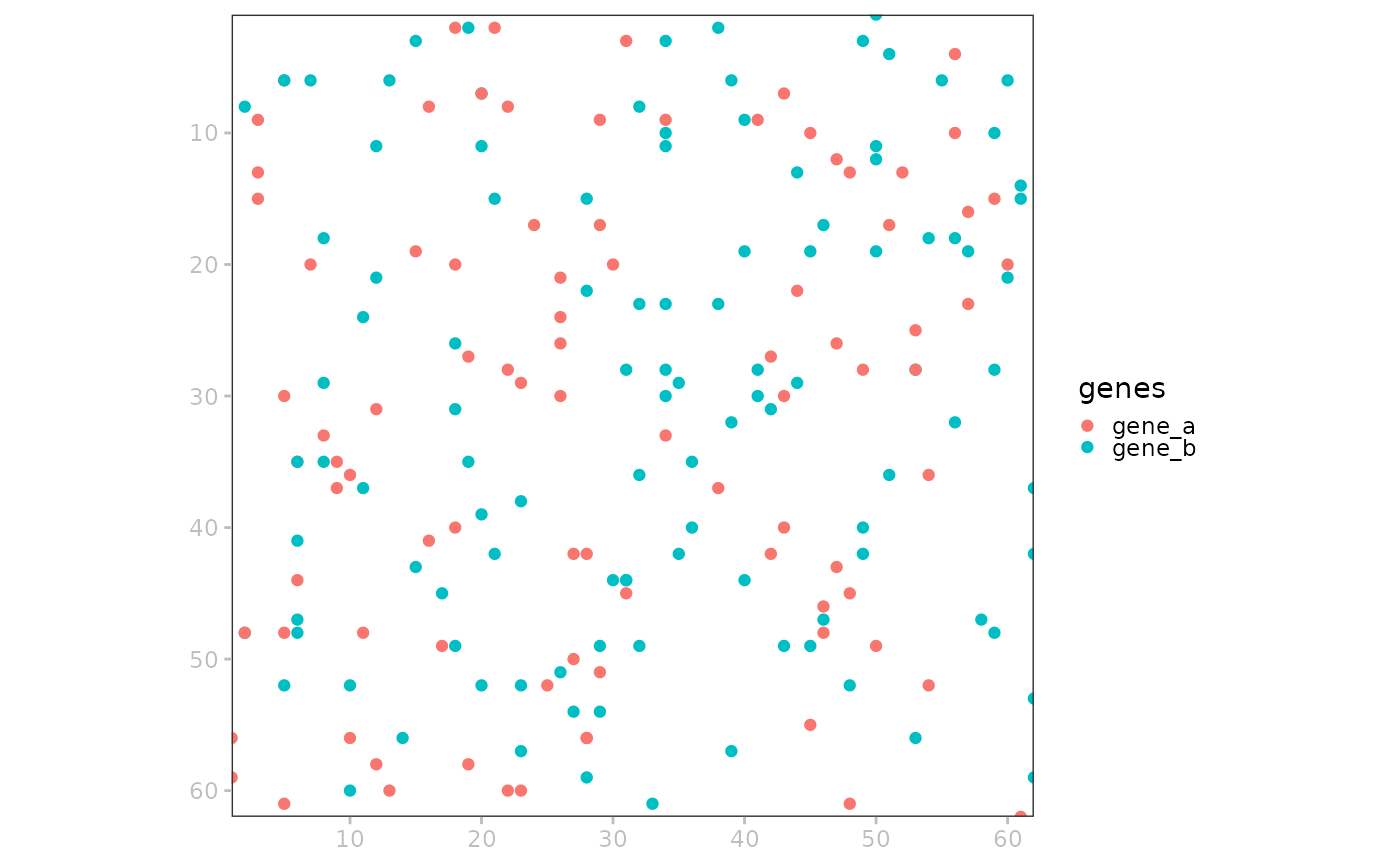
 p + plotPoint(x, i, colour="genes") # discrete
#> Don't know how to automatically pick scale for object of type <NULL>.
#> Defaulting to continuous.
#> Coordinate system already present.
#> ℹ Adding new coordinate system, which will replace the existing one.
p + plotPoint(x, i, colour="genes") # discrete
#> Don't know how to automatically pick scale for object of type <NULL>.
#> Defaulting to continuous.
#> Coordinate system already present.
#> ℹ Adding new coordinate system, which will replace the existing one.
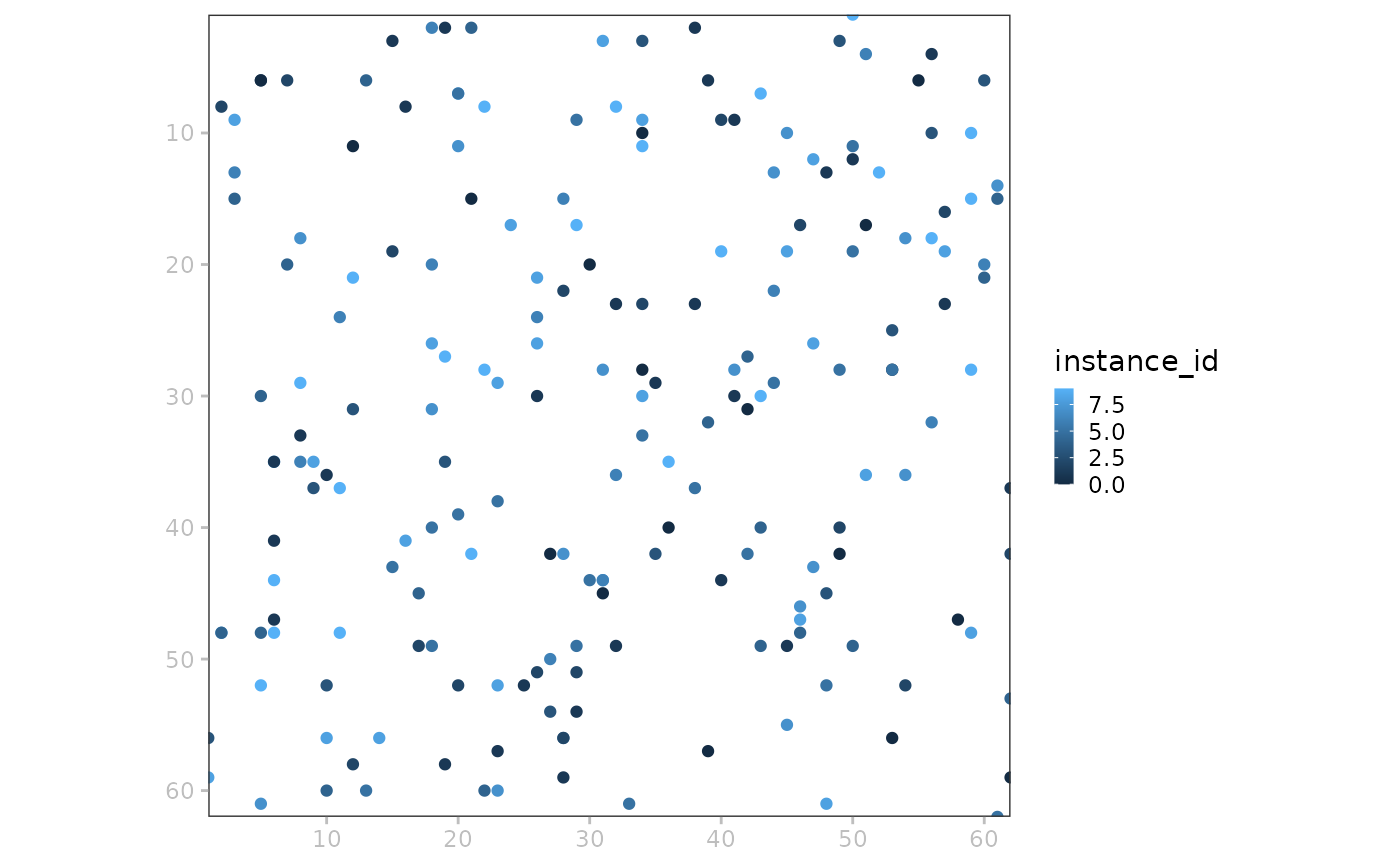
 p + plotPoint(x, i, colour="instance_id") # continuous
#> Don't know how to automatically pick scale for object of type <NULL>.
#> Defaulting to continuous.
#> Coordinate system already present.
#> ℹ Adding new coordinate system, which will replace the existing one.
p + plotPoint(x, i, colour="instance_id") # continuous
#> Don't know how to automatically pick scale for object of type <NULL>.
#> Defaulting to continuous.
#> Coordinate system already present.
#> ℹ Adding new coordinate system, which will replace the existing one.