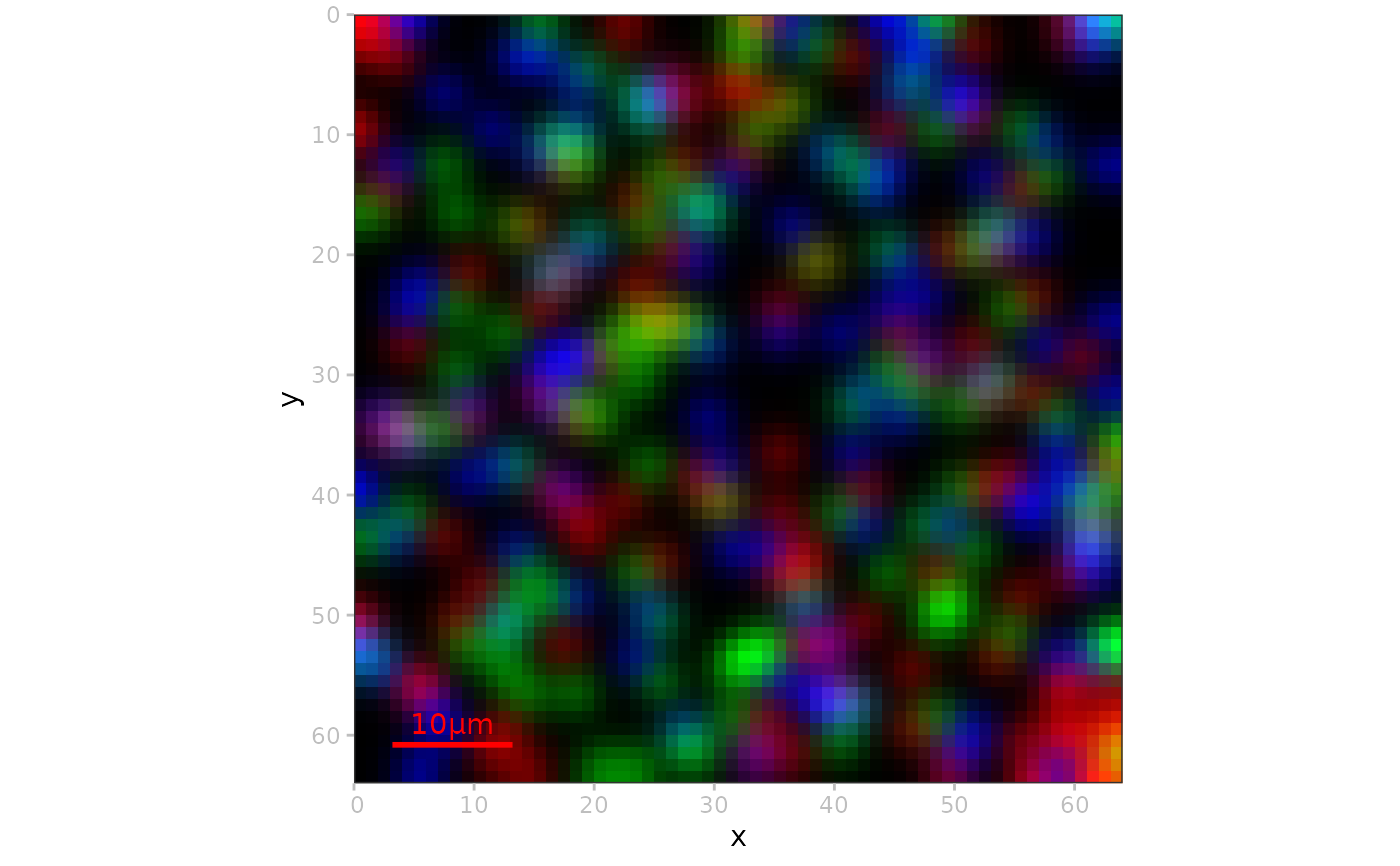
SpatialDataArray scalebar
Arguments
- x
a
SpatialDataArrayobject (i.e., image or label element from aSpatialDataobject).- len
scalar numeric giving the length of the scalebar in physical coordinate space; the unit will be extracted from the data's Zarr specifications (see
axes(x)).- col
string indicating the color to use for the scalebar.
- lwd
scalar numeric indicating the linewidth to use for the scalebar.
- xrel, yrel
scalar numeric indicating relative position of the scalebar.
Examples
zs <- file.path("extdata", "blobs.zarr")
zs <- system.file(zs, package="spatialdataR")
sd <- readSpatialData(zs, tables=FALSE)

# mock unit (data misses specification!)
md <- meta(image(sd, 2))
md$multiscales[[1]]$axes[[3]]$unit <- "micron"
sd$images[[2]]@meta <- md

plotSpatialData() +
  plotImage(sd, i=2) +
  scalebar(image(sd, i=2), len=10)